
Looks can be deceiving
Real-world Inspiration
This is likely my last post on Network Tracing. I just can't help myself, as recently I had a rather interesting case of where traceroute can be deceiving.
A user reported an issue where they experienced consistent small amounts of packet loss on their L2VPN LAN Extension. The issue started a few days ago and was still in effect. They provided proof via a ping, such as this:
patientuser@host:~$ ping 10.20.20.20 -c 50 | egrep -i "trans|rtt"
50 packets transmitted, 45 received, 10% packet loss, time 49187ms
rtt min/avg/max/mdev = 6.774/8.001/13.354/1.058 ms
patientuser@host:~$
My colleague decided to test it out. At first, the ping looked clean.... but uping the amount of echoes reproduced the loss.
RP/0/0/CPU0:XRv-1#ping 10.255.255.10 so lo0

Type escape sequence to abort.
Sending 5, 100-byte ICMP Echos to 10.255.255.10, timeout is 2 seconds:
!!!!!
Success rate is 100 percent (5/5), round-trip min/avg/max = 1/4/9 ms
RP/0/0/CPU0:XRv-1#
RP/0/0/CPU0:XRv-1#
RP/0/0/CPU0:XRv-1#ping 10.255.255.10 so lo0 count 100

Type escape sequence to abort.
Sending 100, 100-byte ICMP Echos to 10.255.255.10, timeout is 2 seconds:
!!!!!!!.!!!!!!!!!!!!!!!!!...!!!!!!!!!!!!!!.!!!!!!!!!.!!!!!!!!!!!!!!!!!
!.!!!!!!!!!!!!!!!!.!!!!!!!!!!!
Success rate is 92 percent (92/100), round-trip min/avg/max = 1/5/9 ms
RP/0/0/CPU0:XRv-1#
So the loss seemed to be somewhere between the ingress PE and the egress as it traverses to the egress PE. He also confirmed that it was showing in MPLS OAM testing. He then called me over for some shoulder surfing support.
Spot The Problem
A quick traceroute, to determine where the issue was... across a few tests, things to go awry around hop 3:
RP/0/0/CPU0:XRv-1#traceroute 10.255.255.10 so lo0


Type escape sequence to abort.
Tracing the route to 10.255.255.10

 1  10.1.2.2 [MPLS: Label 16010 Exp 0] 0 msec  0 msec  0 msec
 2  10.2.7.7 [MPLS: Label 16010 Exp 0] 0 msec  0 msec  0 msec
 3  10.6.7.6 [MPLS: Label 16010 Exp 0] 0 msec  0 msec  *   <---- here
 4  10.6.9.9 [MPLS: Label 16010 Exp 0] 0 msec  0 msec  0 msec
 5  10.9.10.10 0 msec  *  0 msec
RP/0/0/CPU0:XRv-1#

RP/0/0/CPU0:XRv-1#traceroute 10.255.255.10 so lo0


Type escape sequence to abort.
Tracing the route to 10.255.255.10

 1  10.1.2.2 [MPLS: Label 16010 Exp 0] 9 msec  0 msec  0 msec
 2  10.2.7.7 [MPLS: Label 16010 Exp 0] 0 msec  0 msec  0 msec
 3  10.6.7.6 [MPLS: Label 16010 Exp 0] 0 msec  0 msec  0 msec
 4  10.6.9.9 [MPLS: Label 16010 Exp 0] 0 msec  0 msec  *   <---- hop 4
 5  10.9.10.10 0 msec  *  0 msec
RP/0/0/CPU0:XRv-1#

RP/0/0/CPU0:XRv-1#traceroute 10.255.255.10 so lo0


Type escape sequence to abort.
Tracing the route to 10.255.255.10

 1  10.1.2.2 [MPLS: Label 16010 Exp 0] 0 msec  0 msec  0 msec
 2  10.2.7.7 [MPLS: Label 16010 Exp 0] 0 msec  0 msec  0 msec
 3  10.6.7.6 [MPLS: Label 16010 Exp 0] 0 msec  *  0 msec    <----- hop 3
 4  10.6.9.9 [MPLS: Label 16010 Exp 0] 0 msec  0 msec  0 msec
 5  10.9.10.10 0 msec  *  0 msec
RP/0/0/CPU0:XRv-1#
In my lab, it's quite obvious where this PtP interface is between (router 6 & 7), but in our production... it's more arbitrary so we queried the LSDB:
RP/0/0/CPU0:XRv-1#show ip route 10.6.7.6 | i entry

Routing entry for 10.6.7.0/24
RP/0/0/CPU0:XRv-1#
RP/0/0/CPU0:XRv-1#show isis database detail | i "Host|10.6.7.0/24" | utility e$

  Hostname:       XRv-6
  Metric: 500        IP-Extended 10.6.7.0/24
--
  Hostname:       XRv-7
  Metric: 10         IP-Extended 10.6.7.0/24
RP/0/0/CPU0:XRv-1#
We then hopped to that router to test the ingress/egress adjacency:
RP/0/0/CPU0:XRv-7#show isis adjacency | i v-6

XRv-6          Gi0/0/0/3        0c83.0a4f.0006 Up    21   00:21:31 Yes None None
RP/0/0/CPU0:XRv-7#show arp | i 0/0/0/3

10.6.7.6        00:21:36   0c83.0a4f.0006  Dynamic    ARPA  GigabitEthernet0/0/0/3
10.6.7.7        -          0cf0.832b.0004  Interface  ARPA  GigabitEthernet0/0/0/3
RP/0/0/CPU0:XRv-7#ping 10.6.7.6 count 500 size 1472 donotfrag

Type escape sequence to abort.
Sending 500, 1472-byte ICMP Echos to 10.6.7.6, timeout is 2 seconds:
!!!!!!!!!!!!!!!!!!!!!!!!!!!!!!!!!!!!!!!!!!!!!!!!!!!!!!!!!!!!!!!!!!!!!!
!!!!!!!!!!!!!!!!!!!!!!!!!!!!!!!!!!!!!!!!!!!!!!!!!!!!!!!!!!!!!!!!!!!!!!
!!!!!!!!!!!!!!!!!!!!!!!!!!!!!!!!!!!!!!!!!!!!!!!!!!!!!!!!!!!!!!!!!!!!!!
!!!!!!!!!!!!!!!!!!!!!!!!!!!!!!!!!!!!!!!!!!!!!!!!!!!!!!!!!!!!!!!!!!!!!!
!!!!!!!!!!!!!!!!!!!!!!!!!!!!!!!!!!!!!!!!!!!!!!!!!!!!!!!!!!!!!!!!!!!!!!
!!!!!!!!!!!!!!!!!!!!!!!!!!!!!!!!!!!!!!!!!!!!!!!!!!!!!!!!!!!!!!!!!!!!!!
!!!!!!!!!!!!!!!!!!!!!!!!!!!!!!!!!!!!!!!!!!!!!!!!!!!!!!!!!!!!!!!!!!!!!!
!!!!!!!!!!
Success rate is 100 percent (500/500), round-trip min/avg/max = 1/1/9 ms
RP/0/0/CPU0:XRv-7#
Clean as a whistle... hmmm... we continued on & checked hop 4, as we saw something there:
RP/0/0/CPU0:XRv-6#show isis adjacency | i v-9

XRv-9          Gi0/0/0/3        0c06.7e75.0002 Up    26   00:22:44 Yes None None
RP/0/0/CPU0:XRv-6#show arp | i 0/0/3

10.6.9.6        -          0c83.0a4f.0004  Interface  ARPA  GigabitEthernet0/0/0/3
10.6.9.9        00:22:48   0c06.7e75.0002  Dynamic    ARPA  GigabitEthernet0/0/0/3
RP/0/0/CPU0:XRv-6#ping 10.6.9.9 count 500 size 1472 donotfrag

Type escape sequence to abort.
Sending 500, 1472-byte ICMP Echos to 10.6.9.9, timeout is 2 seconds:
!!!!!!!!!!!!!!!!!!!!!!!!!!!!!!!!!!!!!!!!!!!!!!!!!!!!!!!!!!!!!!!!!!!!!!
!!!!!!!!!!!!!!!!!!!!!!!!!!!!!!!!!!!!!!!!!!!!!!!!!!!!!!!!!!!!!!!!!!!!!!
!!!!!!!!!!!!!!!!!!!!!!!!!!!!!!!!!!!!!!!!!!!!!!!!!!!!!!!!!!!!!!!!!!!!!!
!!!!!!!!!!!!!!!!!!!!!!!!!!!!!!!!!!!!!!!!!!!!!!!!!!!!!!!!!!!!!!!!!!!!!!
!!!!!!!!!!!!!!!!!!!!!!!!!!!!!!!!!!!!!!!!!!!!!!!!!!!!!!!!!!!!!!!!!!!!!!
!!!!!!!!!!!!!!!!!!!!!!!!!!!!!!!!!!!!!!!!!!!!!!!!!!!!!!!!!!!!!!!!!!!!!!
!!!!!!!!!!!!!!!!!!!!!!!!!!!!!!!!!!!!!!!!!!!!!!!!!!!!!!!!!!!!!!!!!!!!!!
!!!!!!!!!!
Success rate is 100 percent (500/500), round-trip min/avg/max = 1/1/9 ms
RP/0/0/CPU0:XRv-6#
Also clean. To ensure we were in the right direction, we pinged back towards the ingress PE and also towards the egress PE. Sure enough, we were getting closer:
RP/0/0/CPU0:XRv-6#ping 10.255.255.10 count 100

Type escape sequence to abort.
Sending 100, 100-byte ICMP Echos to 10.255.255.10, timeout is 2 seconds:
!.!!!!!.!.!.!!!!!!!!!!!!!!!.!!!!!!!!!.!.
Success rate is 82 percent (33/40), round-trip min/avg/max = 1/1/9 ms
RP/0/0/CPU0:XRv-6#ping 10.255.255.1 count 100

Type escape sequence to abort.
Sending 100, 100-byte ICMP Echos to 10.255.255.1, timeout is 2 seconds:
!!!!!!!!!!!!!!!!!!!!!!!!!!!!!!!!!!!!!!!!!!!!!!!!!!!!!!!!!!!!!!!!!!!!!!
!!!!!!!!!!!!!!!!!!!!!!!!!!!!!!
Success rate is 100 percent (100/100), round-trip min/avg/max = 1/2/19 ms
RP/0/0/CPU0:XRv-6#
We verified hop 5 (there were 6 hops in production) and moved onto the egress PE itself. Sure enough, we spotted the loss on a particular ingress interface:
RP/0/0/CPU0:XRv-10#show arp | i Dyna

10.5.10.5       00:24:36   0cde.5dc8.0004  Dynamic    ARPA  GigabitEthernet0/0/0/0
10.9.10.9       00:24:48   0c06.7e75.0004  Dynamic    ARPA  GigabitEthernet0/0/0/1
RP/0/0/CPU0:XRv-10#ping 10.9.10.9 count 100

Type escape sequence to abort.
Sending 100, 100-byte ICMP Echos to 10.9.10.9, timeout is 2 seconds:
!!!!!!!!!!!!!!!!!!!!!!!!!!!!!!!!!!!!!!!!!!!!!!!!!!!!!!!!!!!!!!!!!!!!!!
!!!!!!!!!!!!!!!!!!!!!!!!!!!!!!
Success rate is 100 percent (100/100), round-trip min/avg/max = 1/1/9 ms
RP/0/0/CPU0:XRv-10#


RP/0/0/CPU0:XRv-10#ping 10.5.10.5 count 100

Type escape sequence to abort.
Sending 100, 100-byte ICMP Echos to 10.5.10.5, timeout is 2 seconds:
!!!!!!!.!!!!!!!!!!!!!!!!.!!!!!!.!!!.!!!!!!!.!!!!!.!!!!!.!!!!!!!!!!!.!!
!!!!!!.!!!!!!!!!!!!!!!.!!!!!!!
Success rate is 90 percent (90/100), round-trip min/avg/max = 1/1/9 ms
RP/0/0/CPU0:XRv-10#
What the FEC?
So, if you look closer at the beginning traces.... the issue seems to be more apparent at hop 5:
RP/0/0/CPU0:XRv-1#traceroute 10.255.255.10 so lo0

<snip>
 5  10.9.10.10 0 msec  *  0 msec
RP/0/0/CPU0:XRv-1#

RP/0/0/CPU0:XRv-1#traceroute 10.255.255.10 so lo0

<snip>
 5  10.9.10.10 0 msec  *  0 msec
RP/0/0/CPU0:XRv-1#

RP/0/0/CPU0:XRv-1#traceroute 10.255.255.10 so lo0

<snip>
 5  10.9.10.10 0 msec  *  0 msec
RP/0/0/CPU0:XRv-1#
Suddenly it dawned on me as to why. As indicatd in the following RFCs: [3032] && [4950] , when TTL expires in an MPLS label in transit... the ingress LSR will inspect the underlying IP header, if applicable. It will utilize the Source IP in the header & deliver an ICMP TTL Exceeded (ICMP type 11, code 0) message to the source of the packet, now as the destination, with it's ingress interface as the source.
A potential problem is that the LSR may not know how to reach the source of the packet at all. In fact, the LSR may have almost no knowledge of anything outside of the MPLS core. Since the PE's likely have an idea of the VRF/L2 instance, the LSR will utilize the outer/transit label & re-generate a fresh packet towards the Z-end PE that the original transit label was targetting. Once the Z-End PE receives the payload, it will then forward it back over the core towards the source – as it knows exactly how to reach the node.
That means that many of the ICMP TTL expiry messages were being tunneled via the problematic Line-Card with the packet loss.
Captures Or It Didn't Happen
I've created some packet captures in my lab to demonstrate this:
RP/0/0/CPU0:XRv-1#traceroute 10.255.255.10 so lo0 minttl 2 maxttl 2


Type escape sequence to abort.
Tracing the route to 10.255.255.10

 2  10.2.7.7 [MPLS: Label 16010 Exp 0] 0 msec  0 msec  0 msec
RP/0/0/CPU0:XRv-1#traceroute 10.255.255.10 so lo0 minttl 2 maxttl 2


Type escape sequence to abort.
Tracing the route to 10.255.255.10

 2  10.2.7.7 [MPLS: Label 16010 Exp 0] 9 msec  0 msec  *
RP/0/0/CPU0:XRv-1#
Router 7 generated an ICMP expiry to Router 1 & sourced it from it's ingress interface facing router 2
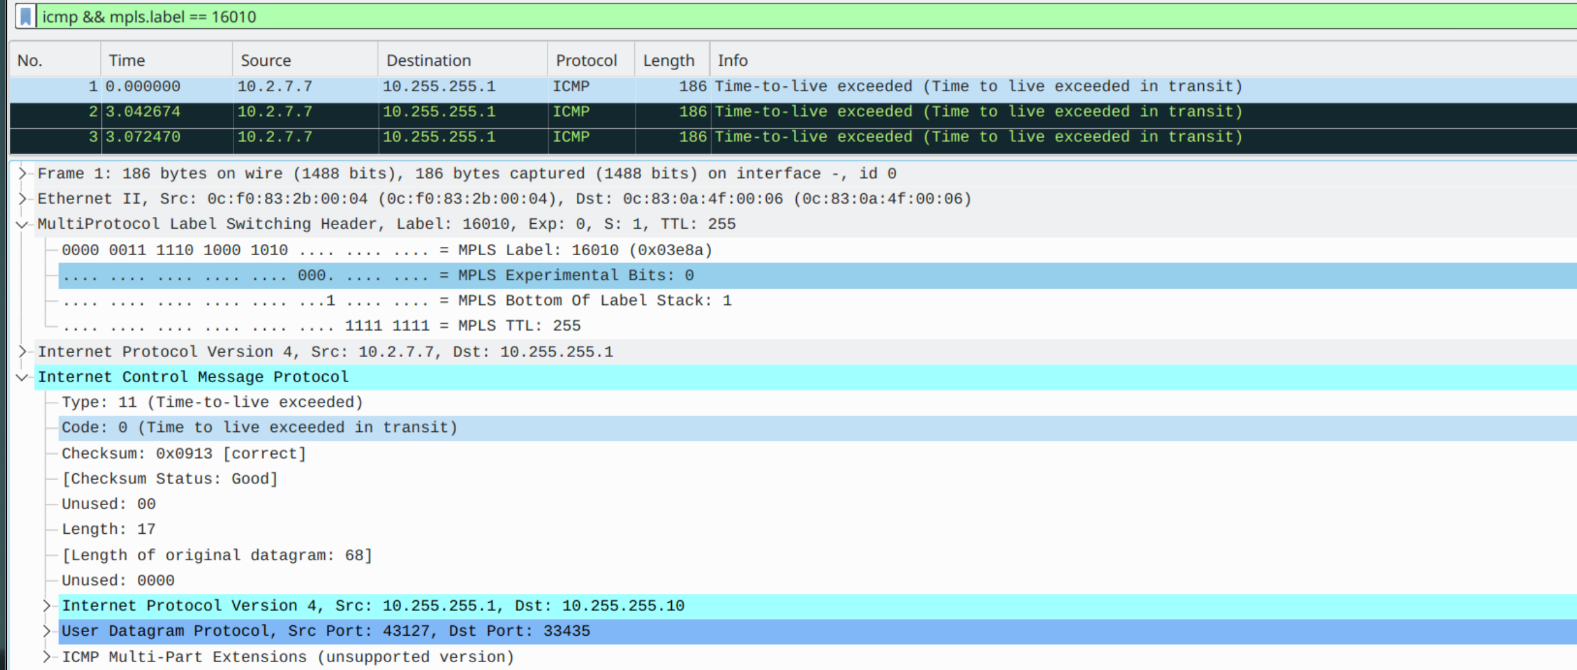
PHP is performed as the packet comes ingress into Router 10 and Router 10 is able to determine the best way to reach the destination, Router 1, via the core:
RP/0/0/CPU0:XRv-10#
RP/0/0/CPU0:XRv-10#show isis adjacency | i v-5

XRv-5          Gi0/0/0/0        0cde.5dc8.0004 Up    7    00:41:55 Yes None None
RP/0/0/CPU0:XRv-10#show interfaces gigabitEthernet 0/0/0/0 | i bia

  Hardware is GigabitEthernet, address is 0cd9.4a8c.0001 (bia 0cd9.4a8c.0001)
RP/0/0/CPU0:XRv-10#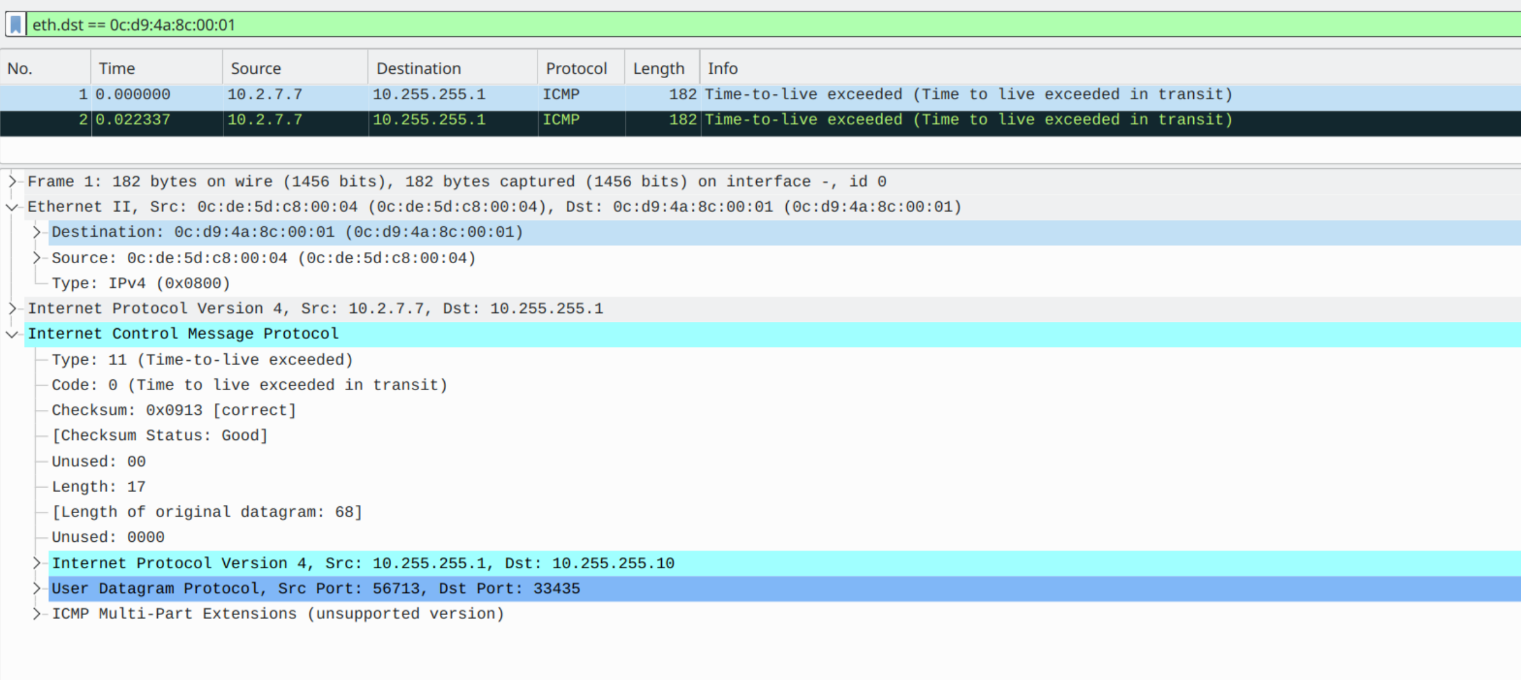
Finally, Router 10 sends on the ICMP payload with the transit label of Router 1 (in this case, it's Node-SID):
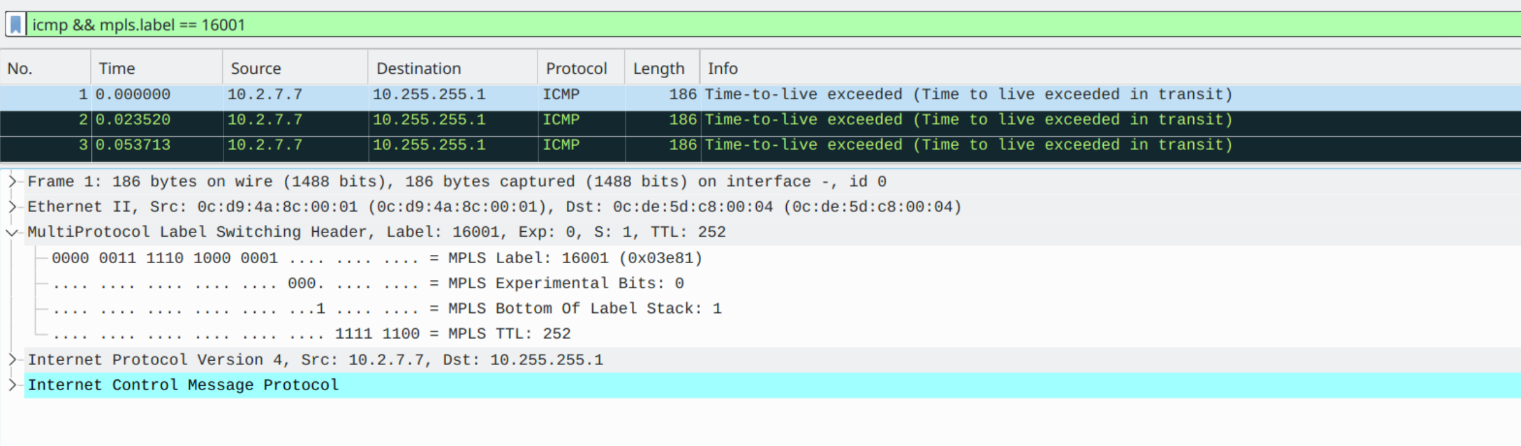
Traceroute will then see the ICMP encapsulated headers/Datagram data and understand that it's for the relevant probe @ Hop 2.
Yet another reason why Traceroute is weird and sometimes it's best to roll up the sleeves and just verify hop by hop.