
Querying the LSDB
Once Upon a Night Shift Dreary
I recently performed a couple training sessions for my team. The subject of the training was "Network Core Tracing", as I've found – in regards to tracing in the core – there's a fair amount of inertia to just get started. This prolongs the outage and creates unnecessary MTTR growth.
I feel like a particular mentor of mine, Ray, would've smacked me in the back of the head if I didn't start tracing – once I've absolved the demarcs of guilt. He was a huge advocate of "Knowing the Flow". He was so right. So much can be found if you just... look.
He didn't care how I did it, as long as I knew all the potential paths of a particular flow – or sets of flows, if the application has multiple streams. Leave no hop unchecked. Leave no logs unread. At least until you've found the problem.
This really mattered in our environment. We deployed a lot of stateful firewalls with ACLs applied ingress on every interface; If a rule was missing, you really needed to consider where a flow would enter an interface. Although the firewall should've allowed the packets to flow in the return path, by being considered "related", sometimes there was issues. You had to be thorough.
How We Can Be Many Places At Once
I do understand the inertia. In a very widespread WAN environment – or a DC environment – it can seem that doing something as simple as logging into each node in the path, checking it's next hop in the FIB, and logging into those boxes poses a problem:
- Each box could have several diverse paths to the ultimate destination.
- Each of those diverse paths nodes could also have several diverse paths to the destination, causing the tree to grow exponentially.
- In an evironment where you have access controls, such as an one-time-password fob, it could seem like a very daunting – also time consuming – task to login to 30 or 40 routers.
In the BGP-does-everything era, many people in modern DCs/Cloud environments know that BGP tables can give verbose information about why routes are selected, who they learned it from and where it originated from. Thus, it's not too hard to trace things down.
But what about in ISP environments, where we often rely on IGPs like OSPF & IS-IS? Well, those protocols also keep databases. Just like Google Maps, or the Kwisatz Haderach of Dune, you can search through the state & details of many links to trace out your network from practically anywhere.

What Do The Routers Know
IS-IS, being a Link-State Protocol, is very powerful. It advertises Link-State information via TLVs (type, length, value). Some very useful TLVs are:
- Type 135 - Extended IP Reachability (Prefixes the Router can reach directly)
- Type 132 - IP Interface Address (Essentially IPv4 Router-ID)
- Type 137 - Dynamic Name (Hostname of Router)
- Type 22 - Extended IS reachability (Adjacencies)
That's a lot of information to query from. More than enough to make sense of a traceroute, dynamically map out a network, or even keep track of topology changes.
Get Your Spice Coffee Ready For This One
Let's see if we can utilize these elements to trace from two routers. Let's say a customer of ours reports an issue from one site to another. They tell us the name of the first site, as it's their head-office. As for the other site, they are vague on details. They simply provide source & destination prefixes for us to work out.
We know the site they mentioned is connected to R1. We determine that the prefix is being learned via BGP neighbour 203.0.113.210 . We check our IS-IS topology to find out who that is:
RP/0/0/CPU0:R1#show isis topology detail | i 203.0.113.210

R10 (203.0.113.210) [ucast 50 mcast <infinity>]
RP/0/0/CPU0:R1#
Now we check our next-hop towards R10:
RP/0/0/CPU0:R1#show ip route 203.0.113.210 | i "entry|via"

Routing entry for 203.0.113.210/32
  Known via "isis zeal", distance 115, metric 60, type level-2
    203.0.113.1, from 203.0.113.210, via GigabitEthernet0/0/0/0
RP/0/0/CPU0:R1#
RP/0/0/CPU0:R1#show isis adjacency | i 0/0/0/0

R2             Gi0/0/0/0        *PtoP*         Up    29   03:15:45 No  None None
RP/0/0/CPU0:R1#
Thank you very much, TLVs 137 & 132.
We now know this much about the topology:
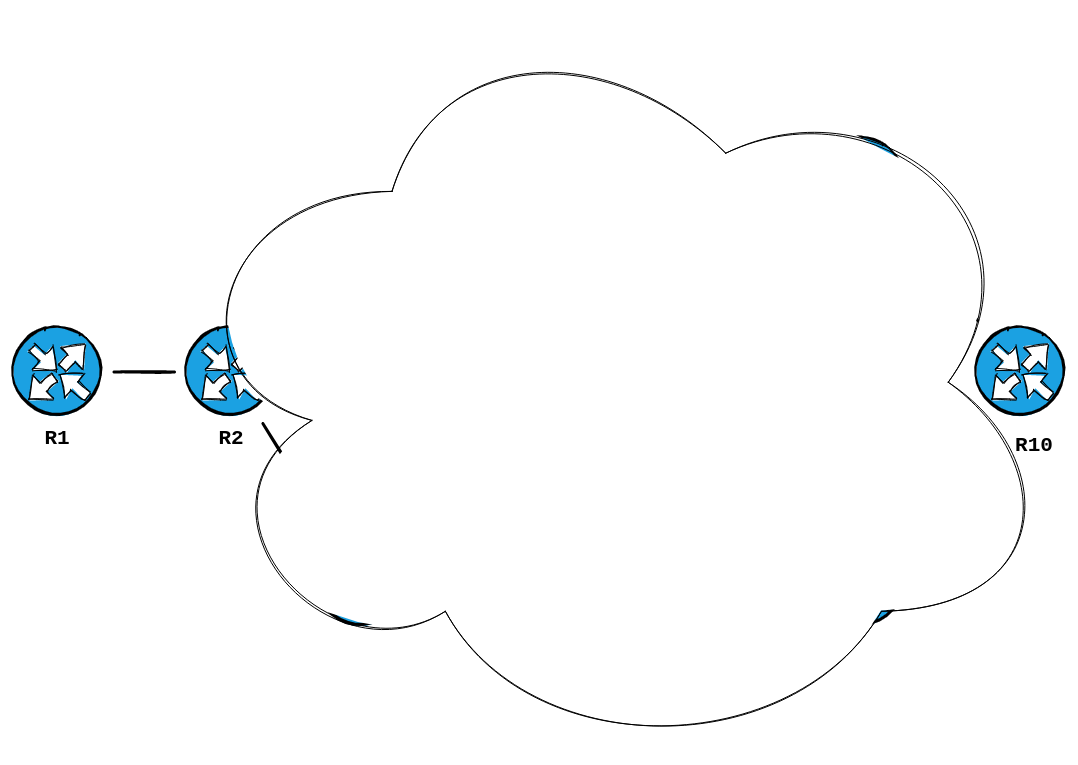
Okay, so we said we won't login to any other router, right? So what do we do? We can utilize traceroute. Let's give that a try.
But before we do, there's something missing from my lab.
Lab Setup
As I mentioned in a previous post, I would be utilizing VyOS from now on as my P routers in my lab cores. This is because they're quicker to boot, maintain, and they support ECMP.... but with a catch.
When I first did my tests I found that ECMP in VyOS, by default, was only hashing on the L3 tuples of Src & Dst IP .....
RP/0/0/CPU0:R1#traceroute 203.0.113.210


Type escape sequence to abort.
Tracing the route to 203.0.113.210

 1  203.0.113.1 0 msec  0 msec  0 msec
 2  203.0.113.3 0 msec  0 msec  0 msec
 3  203.0.113.7 0 msec  0 msec  0 msec
 4  203.0.113.17 0 msec  0 msec  0 msec
 5  203.0.113.210 0 msec  0 msec  0 msec
RP/0/0/CPU0:R1#
I confirmed this by adding 15 extra Loopbacks & sourcing my traces from those interfaces.
RP/0/0/CPU0:R1#show ip int br | i Lo

Loopback0                      203.0.113.201   Up              Up       default
Loopback230                    203.0.113.230   Up              Up       default
Loopback231                    203.0.113.231   Up              Up       default
Loopback232                    203.0.113.232   Up              Up       default
Loopback233                    203.0.113.233   Up              Up       default
Loopback234                    203.0.113.234   Up              Up       default
Loopback235                    203.0.113.235   Up              Up       default
Loopback236                    203.0.113.236   Up              Up       default
Loopback237                    203.0.113.237   Up              Up       default
Loopback238                    203.0.113.238   Up              Up       default
Loopback239                    203.0.113.239   Up              Up       default
Loopback240                    203.0.113.240   Up              Up       default
Loopback241                    203.0.113.241   Up              Up       default
Loopback242                    203.0.113.242   Up              Up       default
Loopback243                    203.0.113.243   Up              Up       default
Loopback244                    203.0.113.244   Up              Up       default
Loopback245                    203.0.113.245   Up              Up       default
RP/0/0/CPU0:R1#
That gave me the randomnesss I needed to sniff out that it was indeed using only those two tuples. As every probe, no matter how many, always hit the same hop... but each source IP revealed a new hop.
This is due to the default behaviour of the Linux kernel, as you can see in this great write-up here.
To summarize the fowarding behaviour:
for forwarded IPv4 packets (L3 hash){ Source Address, Destination Address }
for locally generated IPv4 packets (L4 hash) [3]{ Source Address, Destination Address, Protocol, Source Port, Destination Port }
However, with recently released Linux v4.12 selection of fields has changed a bit for IPv4 [4]. An L3 hash is used by default for both forwarded and locally generated traffic, but the user can choose to use the L4 hash, in both forward and local output path, with a new sysctl - net.ipv4.fib_multipath_hash_policy.
Since we are generating the traffic from our IOS-XR box, the VyOS routers in the middle are just forwarding with the L3 Hash. We need to enable the L4-hash for forwarding. In VyOS, this can be enabled using the following commands:
kazaii@R2# set system ip multipath
Possible completions:
   ignore-unreachable-nexthops
                        Ignore next hops that are not in the ARP table
   layer4-hashing       Use layer 4 information for ECMP hashing


[edit]
kazaii@R2#
kazaii@R2# set system ip multipath layer4-hashing
[edit]
kazaii@R2# commit;save;exit
Saving configuration to '/config/config.boot'...
Done
exit
kazaii@R2:~$
After that, ECMP hashing was now enabled for at least 5 tuples.... allowing Traceroute to sniff out the multiple hops.
How Does Traceroute Work Again?
If you find yourself scratching your head as to why the above mattered to Traceroute, and why the probes hit the same hop every time, you might want to review my favourite slide deck on how Traceroute works.
But I'll summarize the most relevant parts:
- Traceroute works by sending probes to find the various hops in a path
- It does this by incrementing the TTL by 1. When router forwards a packet, it decrements the TTL by 1 and sends it on. When TTL reaches 0, an ICMP TTL-Exceeded message is generated and sent back to the source.
- The source measures the delta between the receiving of that message against the sending of the probe to measure the round-trip-time to the hop.
- It also records the source IP of the Router that sent the message to be the presumed hop.
- It often sends 3 probes by default, in many implementations
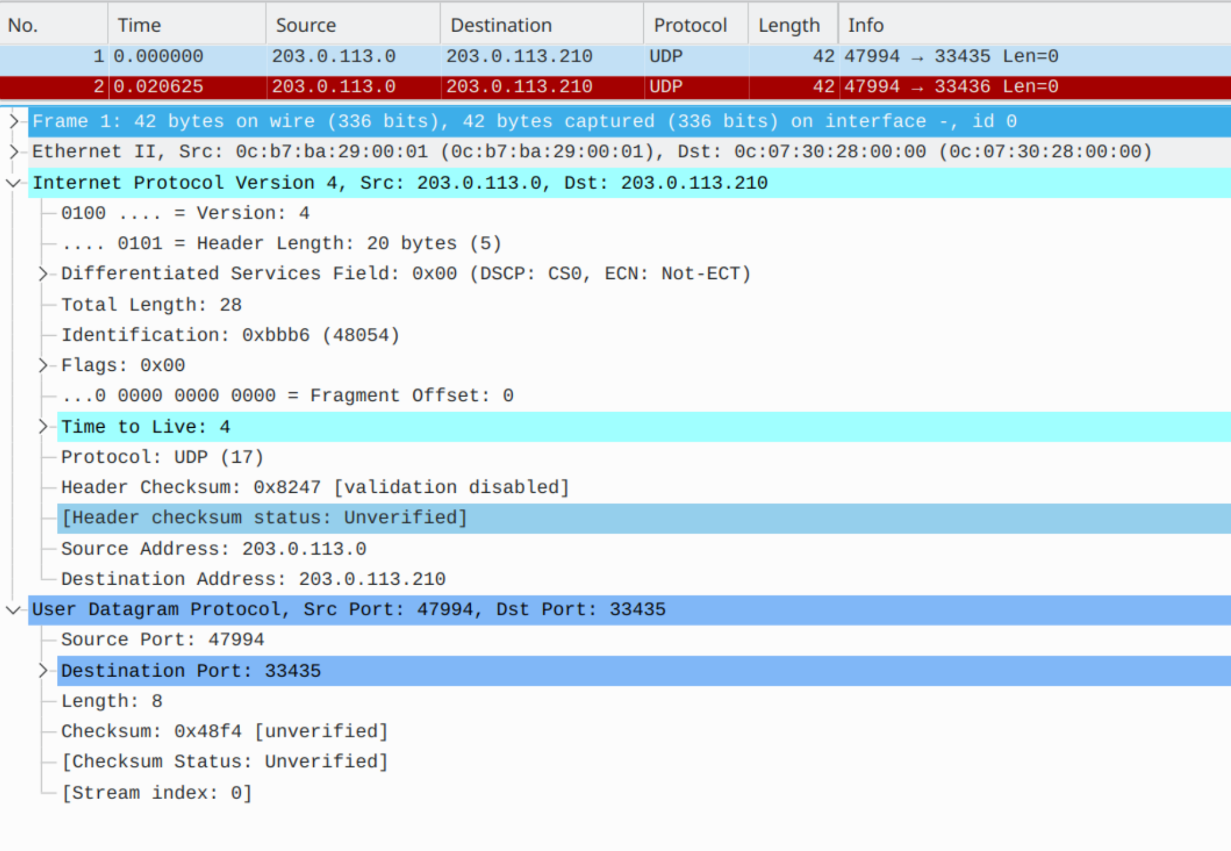
- To encourage routers to hash / load-share the probes across multiple paths, it often utilizes UDP & increments the UDP destination port for each probe.
- Each probe is it's own individual test. No probe traces a complete path by itself – causing rather confusing results, sometimes known as the Paris Traceroute problem.
When you consider the above... even if the many hops in the network consider each probe a separate flow.... they are only hashing based on source & destination IP only. They do not care that each probe has a different UDP port...
RP/0/0/CPU0:R1#traceroute 203.0.113.210 minttl 4 maxttl 4 probe 20

Type escape sequence to abort.
Tracing the route to 203.0.113.210

 4  <snipped out for spoiler>
RP/0/0/CPU0:R1# 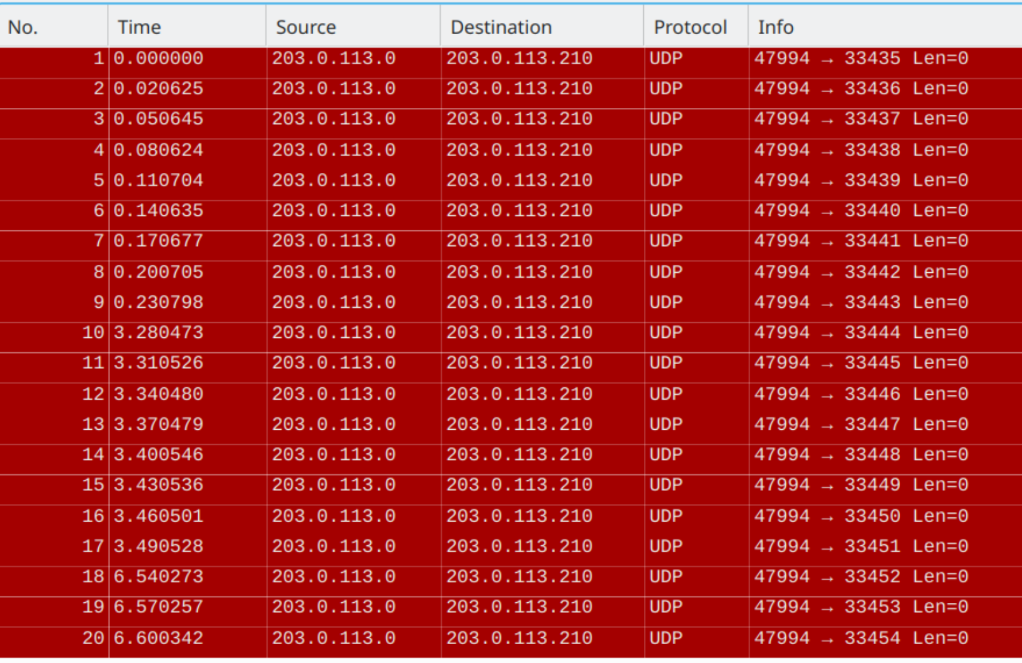
Now that it's fixed, we can setup a test method that would test each hop of the network and ensure we sniff out as many links as we could imagine.
Parsing Method
Okay. So we can sniff out every end-point, at every particular hop in the network. How do we query the Link-State Database to determine what routers that goes through or to?
Well, we can utilize our Loopbacks as an example of what IP Prefixes & Hostnames look like in the LSDB (without spoiling what's to come):
RP/0/0/CPU0:R1#show isis database detail | i "Host|IP-Ext" | utility head -n 10

  Hostname:       R1
  Metric: 10         IP-Extended 203.0.113.0/31
  Metric: 0          IP-Extended 203.0.113.201/32
  Metric: 0          IP-Extended 203.0.113.230/32
  Metric: 0          IP-Extended 203.0.113.231/32
  Metric: 0          IP-Extended 203.0.113.232/32
  Metric: 0          IP-Extended 203.0.113.233/32
  Metric: 0          IP-Extended 203.0.113.234/32
  Metric: 0          IP-Extended 203.0.113.235/32
  Metric: 0          IP-Extended 203.0.113.236/32
RP/0/0/CPU0:R1#
Utilizing data like that, we can go a bit further and use the following command to find the exact IS's are attached to a prefix:
show isis database detail | i "Host|<Prefix>" | utility egrep -B1 "Ext"
With the above command, we will do the following: We will Pipe Include on the following patterns: Host, Prefix. We will then parse the results bit further with the egrep -B1 "Ext" , as egrep will show us the pattern that is 1 line before, due to the -B1 argument.
Since each Prefix is under the LSP entry of each router, the next line will always be the Hostname of the router that advertised it. Let me show the above example, if I match directly on 203.0.113.235/32
RP/0/0/CPU0:R1#show isis database detail | i "Host|203.0.113.235/32" | utility$

  Hostname:       R1
  Metric: 0          IP-Extended 203.0.113.235/32
RP/0/0/CPU0:R1#s
Thank you TLV 135. Thank you extended grep.
On With It
So first let's sniff out Hop 4, since we know from the first trace that we reached R10 in 5 hops.
RP/0/0/CPU0:R1#traceroute 203.0.113.210 minttl 4 maxttl 4 probe 20


Type escape sequence to abort.
Tracing the route to 203.0.113.210

 4  203.0.113.23 9 msec
    203.0.113.27 0 msec
    203.0.113.21 0 msec
    203.0.113.23 0 msec
    203.0.113.27 0 msec  0 msec
    203.0.113.23 0 msec  *  0 msec
    203.0.113.27 0 msec
    203.0.113.23 0 msec
    203.0.113.21 0 msec  *
    203.0.113.27 0 msec
    203.0.113.17 0 msec
    203.0.113.23 0 msec
    203.0.113.17 0 msec
    203.0.113.23 0 msec
    203.0.113.21 0 msec  *
RP/0/0/CPU0:R1#
It hit the following addresses:
- 203.0.113.23
- 203.0.113.27
- 203.0.113.21
- 203.0.113.17
Let's look those up:
RP/0/0/CPU0:R1#show ip route 203.0.113.23 | i entry
Routing entry for 203.0.113.22/31
RP/0/0/CPU0:R1#show ip route 203.0.113.27 | i entry
Routing entry for 203.0.113.26/31
RP/0/0/CPU0:R1#show ip route 203.0.113.21 | i entry
Routing entry for 203.0.113.20/31
RP/0/0/CPU0:R1#show ip route 203.0.113.17 | i entry
Routing entry for 203.0.113.16/31
RP/0/0/CPU0:R1#
RP/0/0/CPU0:R1#show isis database detail | i "Host|203.0.113.22/31" | utility $
Hostname: R6
Metric: 10 IP-Extended 203.0.113.22/31
--
Hostname: R9
Metric: 10 IP-Extended 203.0.113.22/31
RP/0/0/CPU0:R1#show isis database detail | i "Host|203.0.113.26/31" | utility $
Hostname: R7
Metric: 10 IP-Extended 203.0.113.26/31
--
Hostname: R9
Metric: 10 IP-Extended 203.0.113.26/31
RP/0/0/CPU0:R1#show isis database detail | i "Host|203.0.113.20/31" | utility $
Hostname: R6
Metric: 10 IP-Extended 203.0.113.20/31
--
Hostname: R8
Metric: 10 IP-Extended 203.0.113.20/31
RP/0/0/CPU0:R1#show isis database detail | i "Host|203.0.113.16/31" | utility $
Hostname: R5
Metric: 10 IP-Extended 203.0.113.16/31
--
Hostname: R8
Metric: 10 IP-Extended 203.0.113.16/31
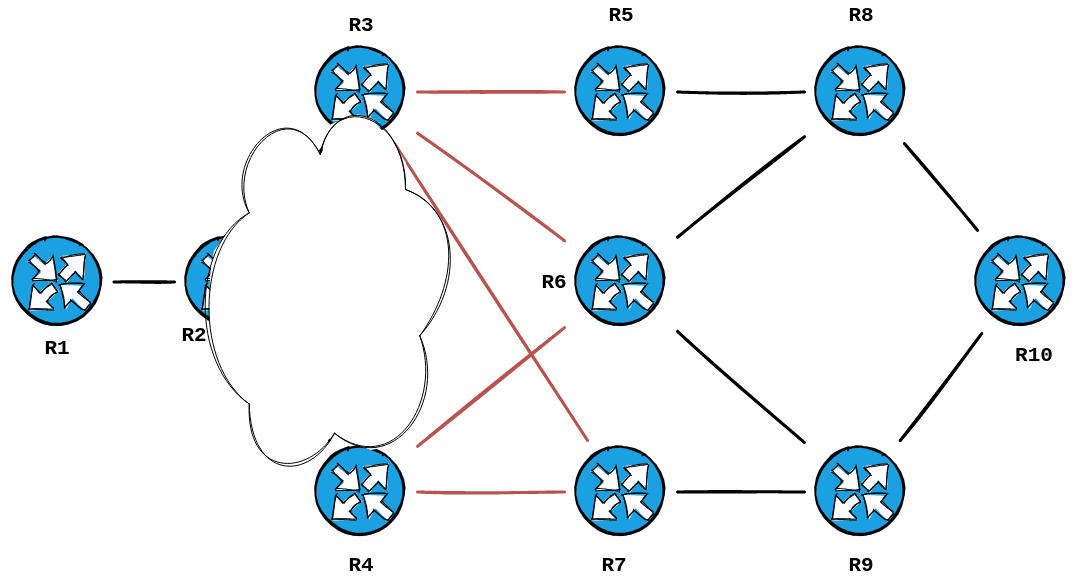
RP/0/0/CPU0:R1#Wow, that's a lot of data to process. But, if we consider what we already know.... The Z-end, which is Hop 5, is R10. So what's connected to R10 ?
We can query the adjacencies advertised into our LSDB to determine that. We will tweak our command above to be IS-Ext , instead of IP-Ext ... we will also limit our results to the LSP ID of R10. This always ends in .00-00 in most networks... but if you forget this, you can wildcard it:
show isis database detail <hostname>.* | i "<hostname>|IS-Ext"
RP/0/0/CPU0:R1#show isis database detail R10.* | i "R10|IS-Ext"

R10.00-00             0x00000019   0x6096        902             0/0/0
  Hostname:       R10
  Metric: 10         IS-Extended R8.00
  Metric: 10         IS-Extended R9.00
RP/0/0/CPU0:R1#
So it's R8 & R9 that's directly connected to R10. With that information, along with the prefixes we sniffed out above... we can start mapping things out.
Thank you TLV 22.
We're getting pretty close. Let's trace Hop 3:
RP/0/0/CPU0:R1#traceroute 203.0.113.210 minttl 3 maxttl 3 probe 20


Type escape sequence to abort.
Tracing the route to 203.0.113.210

 3  203.0.113.15 0 msec
    203.0.113.11 0 msec
    203.0.113.9 0 msec  0 msec
    203.0.113.13 0 msec
    203.0.113.15 0 msec  0 msec  0 msec  0 msec
    203.0.113.7 0 msec  *
    203.0.113.9 0 msec
    203.0.113.11 0 msec
    203.0.113.13 0 msec
    203.0.113.7 0 msec  0 msec
    203.0.113.11 0 msec
    203.0.113.13 0 msec
    203.0.113.7 0 msec
    203.0.113.15 0 msec
RP/0/0/CPU0:R1#
That one was even more wild. It hit the following addresses:
- 203.0.113.15
- 203.0.113.11
- 203.0.113.9
- 203.0.113.13
- 203.0.113.7
Let's look them up:
P/0/0/CPU0:R1#show ip route 203.0.113.15 | i entry

Routing entry for 203.0.113.14/31
RP/0/0/CPU0:R1#show ip route 203.0.113.11 | i entry

Routing entry for 203.0.113.10/31
RP/0/0/CPU0:R1#show ip route 203.0.113.9 | i entry

Routing entry for 203.0.113.8/31
RP/0/0/CPU0:R1#show ip route 203.0.113.13 | i entry

Routing entry for 203.0.113.12/31
RP/0/0/CPU0:R1#show ip route 203.0.113.7 | i entry

Routing entry for 203.0.113.6/31
RP/0/0/CPU0:R1#

RP/0/0/CPU0:R1#show isis database detail | i "Host|203.0.113.14/31" | utility $

  Hostname:       R4
  Metric: 10         IP-Extended 203.0.113.14/31
--
  Hostname:       R7
  Metric: 10         IP-Extended 203.0.113.14/31
RP/0/0/CPU0:R1#show isis database detail | i "Host|203.0.113.10/31" | utility $

  Hostname:       R3
  Metric: 10         IP-Extended 203.0.113.10/31
--
  Hostname:       R7
  Metric: 10         IP-Extended 203.0.113.10/31
RP/0/0/CPU0:R1#show isis database detail | i "Host|203.0.113.8/31" | utility e$

  Hostname:       R3
  Metric: 10         IP-Extended 203.0.113.8/31
--
  Hostname:       R6
  Metric: 10         IP-Extended 203.0.113.8/31
RP/0/0/CPU0:R1#show isis database detail | i "Host|203.0.113.12/31" | utility $

  Hostname:       R4
  Metric: 10         IP-Extended 203.0.113.12/31
--
  Hostname:       R6
  Metric: 10         IP-Extended 203.0.113.12/31
RP/0/0/CPU0:R1#show isis database detail | i "Host|203.0.113.6/31" | utility e$

  Hostname:       R3
  Metric: 10         IP-Extended 203.0.113.6/31
--
  Hostname:       R5
  Metric: 10         IP-Extended 203.0.113.6/31
RP/0/0/CPU0:R1#
Once again, we take the routers we already know... and add the routers in our trace to those. Here's what it looks like now:
One more hop to go. Let's look at Hop 2:
RP/0/0/CPU0:R1#traceroute 203.0.113.210 minttl 2 maxttl 2 probe 20

Type escape sequence to abort.
Tracing the route to 203.0.113.210

 2  203.0.113.3 0 msec
    203.0.113.5 0 msec  0 msec  0 msec  0 msec
    203.0.113.3 0 msec
    203.0.113.5 0 msec
    203.0.113.3 0 msec  0 msec  0 msec  0 msec  *  0 msec  0 msec
    203.0.113.5 0 msec
    203.0.113.3 0 msec
    203.0.113.5 0 msec  *
    203.0.113.3 0 msec  0 msec
RP/0/0/CPU0:R1#
It hit the following addresses:
- 203.0.113.3
- 203.0.113.5
Let's see who those belong to:
RP/0/0/CPU0:R1#show ip route 203.0.113.3 | i entry

Routing entry for 203.0.113.2/31
RP/0/0/CPU0:R1#show ip route 203.0.113.5 | i entry

Routing entry for 203.0.113.4/31
RP/0/0/CPU0:R1#

RP/0/0/CPU0:R1#show isis database detail | i "Host|203.0.113.2/31" | utility e$

  Hostname:       R2
  Metric: 10         IP-Extended 203.0.113.2/31
--
  Hostname:       R3
  Metric: 10         IP-Extended 203.0.113.2/31
RP/0/0/CPU0:R1#show isis database detail | i "Host|203.0.113.4/31" | utility e$

  Hostname:       R2
  Metric: 10         IP-Extended 203.0.113.4/31
--
  Hostname:       R4
  Metric: 10         IP-Extended 203.0.113.4/31
RP/0/0/CPU0:R1#
Well, those are connected to our known first-hop, R2.
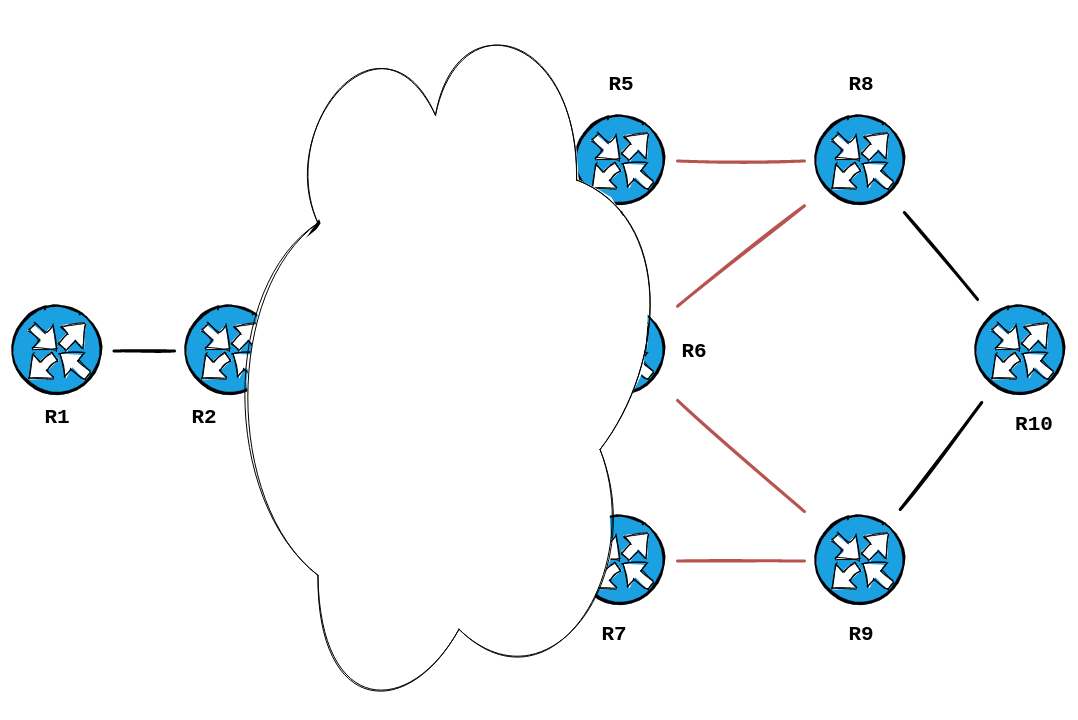
Thus the trace produced this topology:
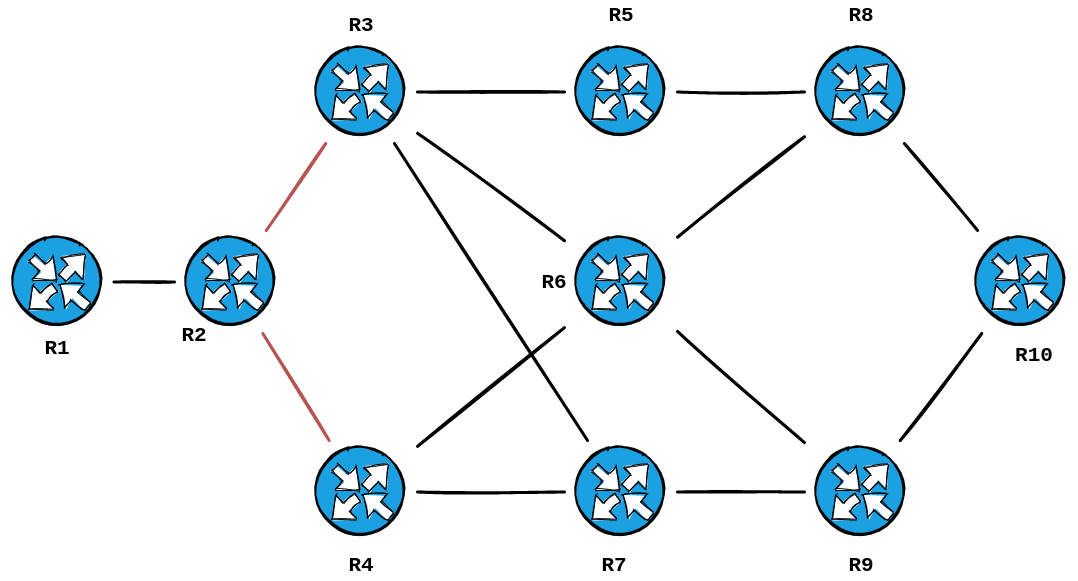
Revealing the topology I built in GNS3:

A very smart cookie would point out that our diagram is missing two links in the topology... the ones between R6 & R7/R5.
The reason being is that Traceroute is determining the paths that would be taken from Source to Destination.... and those particular paths are one hope too many to be sniffed out. 6 hops to be exact, if you use your fingers to trace from R1 -> R2 -> R3 -> R5 -> R6 -> R9 -> R10.
This would be true if there were 200+ routers in your topology. You are utilizing a method that will trace out your path, not the entire WAN diagram, as that's what you're looking for anyway.
If our task was different, and we were trying to map out R6's adjacencies – say, if we were about to set our overload bit, and remove it from the path – we could query it's LSP for IS-Extended reachability, to reveal those links:
RP/0/0/CPU0:R1#show isis database detail R6.* | i "Host|IS-Ext"

  Hostname:       R6
  Metric: 10         IS-Extended R7.00 <----
  Metric: 10         IS-Extended R8.00
  Metric: 10         IS-Extended R5.00 <----
  Metric: 10         IS-Extended R3.00
  Metric: 10         IS-Extended R4.00
  Metric: 10         IS-Extended R9.00
RP/0/0/CPU0:R1#
Now What?
Now that you know the path the packets will walk, you can start your tests.
- Perhaps use a packet-generator to to determine at which point the point the flow fails.
- You can capture on tap points on these links, if possible, to determine where the problem occurs.
- After seeing the topology, you may already know there is a common-point for other queries. It could be R6, which is the most touched router in this flow. Or up-to half of flows go through R9, and a customer directly connected to that router is also reporting recent issues.
- Now that you demystified the path, it might seem less daunting to login to these routers and do the necessary checks. You might find a Line Card that has reached it's scale limit and has been screaming for days-on-end in the logs.
Some Closing Notes
If the customer didn't tell you the A-End, you could've checked the VPN route-reflector to get R1's Loopback IP as your recursive next-hop. Then you could've queried that in the LSDB.
Of course, this example won't always apply 1:1. Maybe traceroute dies before you reach the LB address. Maybe TTL propagation is disabled to hide the core from traces. It still doesn't stop you from utilizing the costs to calculate the paths yourself. You could also utilize my other example to trace it the good old fashioned way.
Do Not Ponder, Weak and Weary
Ray was right all along. It's great & all to know all the nerd knobs of adjacencies, MTU padding, authentication, timers, BFD, TI-LFA, etc. ad-naseum. But when it comes right down to the wire, and you're looking for tangible data, it's even better to know what ol' Dijkstra produced for your particular graph. What the deck of your BGP tables delivered to your hand.
The more your trace your network, the better you know it. The faster you get. The more sure you are of your results. Do it whenever you can.
Know the Flow. Just get started.
Thanks, Ray.