
Without a Trace
How do you find problems in your network? Are you confident you understand tools like Traceroute? Are you familiar with how to read state in your topology? What if traceroute does not apply, like when you are tracing MACs in an L2 network? What about when traceroute is not available?
Let's utilize another hypothetical scenario:
Susan, a talented member of the sysadmin team, advises Mike, from the NOC, of intermittent slowness between two points in a client's managed network. Because Susan is a pro, she provides the source & destination IP, the application Network name, and some captures & outputs.
She advises that some application flows – like curl – seem to be nearly instant in transmission; However, her current SSH session & icmp echo requests/replies seem to be plagued with delay. She also advises that she sees no indication of packet loss.
susan@Host-1:~$ ping 10.20.20.20 -c 3
PING 10.20.20.20 (10.20.20.20) 56(84) bytes of data.
64 bytes from 10.20.20.20: icmp_seq=1 ttl=60 time=208 ms
64 bytes from 10.20.20.20: icmp_seq=2 ttl=60 time=207 ms
64 bytes from 10.20.20.20: icmp_seq=3 ttl=60 time=273 ms

--- 10.20.20.20 ping statistics ---
3 packets transmitted, 3 received, 0% packet loss, time 2001ms
rtt min/avg/max/mdev = 207.702/229.974/273.545/30.816 ms
susan@Host-1:~$ 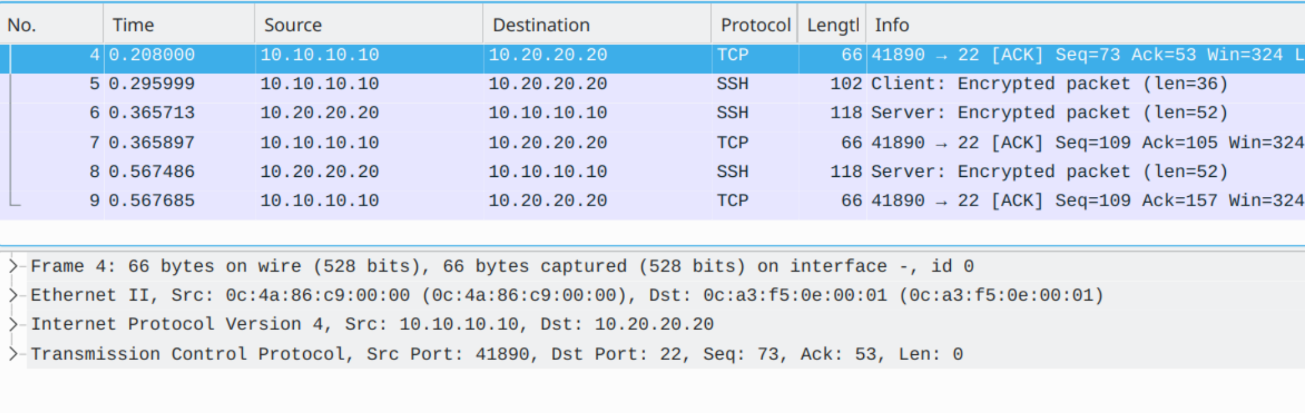
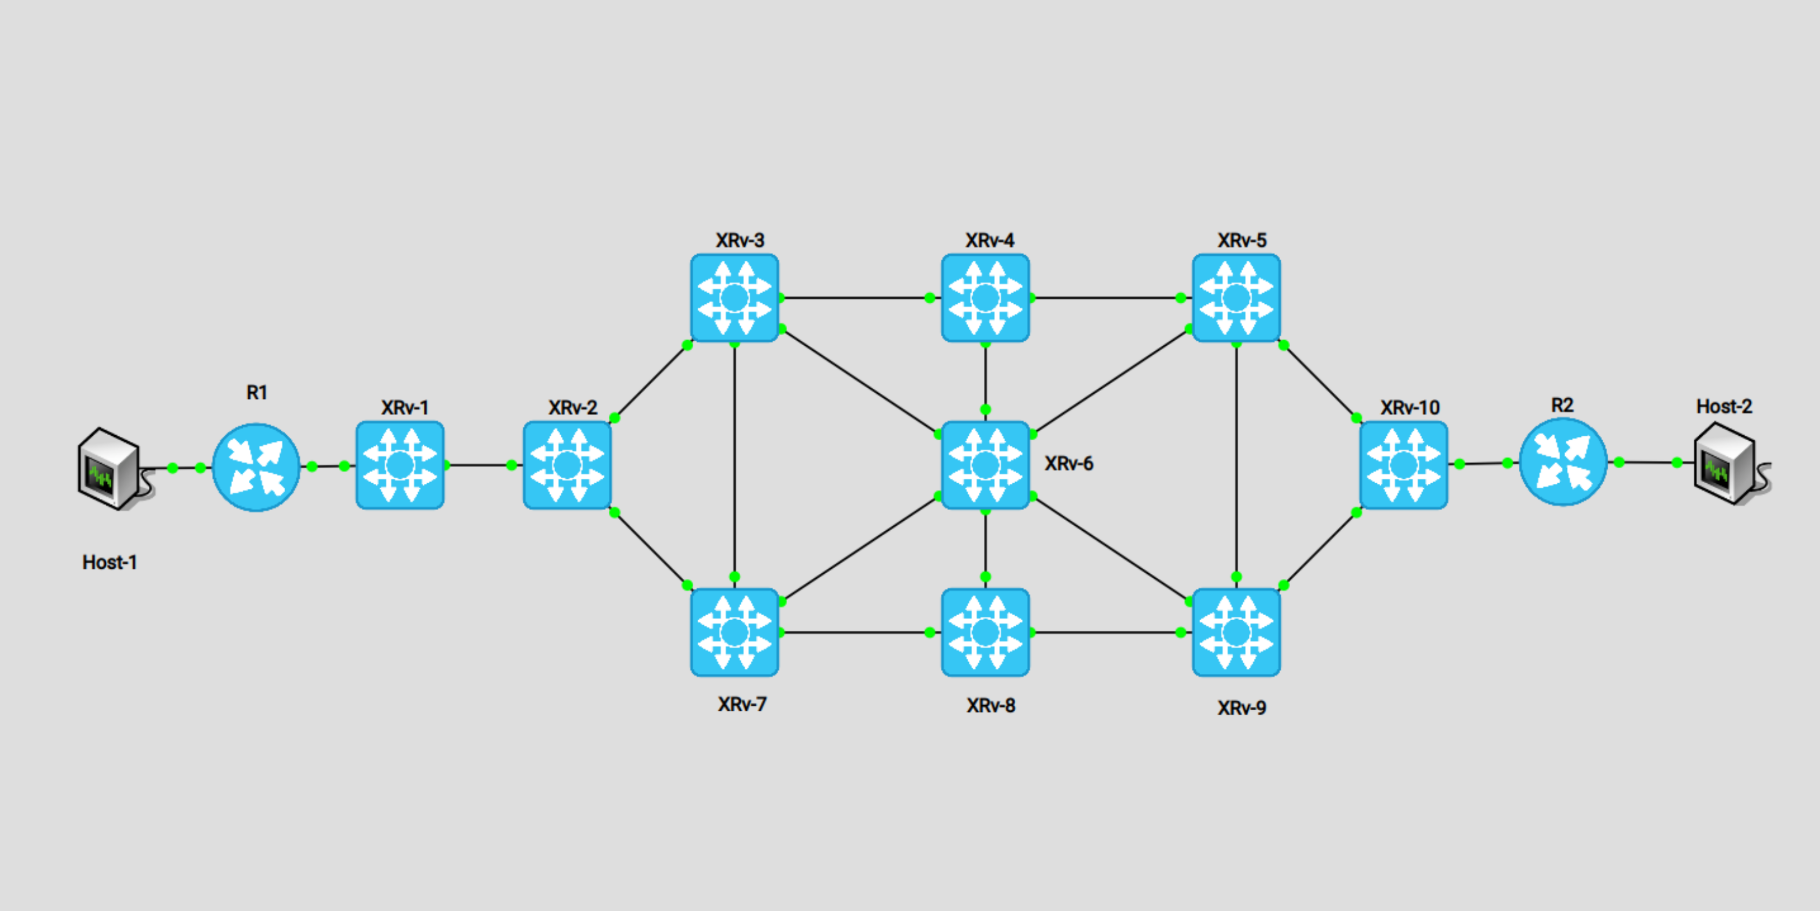
For this scenario, I am utilizing my SR refresher lab again. I have built a EVPN-SR Route-Type 5 (L3VPN) connection between XRv-1 & XRv-10
Mike knows that traceroute would produce less than desirable results:
RP/0/0/CPU0:XRv-1#traceroute 10.255.255.10 so lo0
Sun Jul 10 17:00:02.890 UTC

Type escape sequence to abort.
Tracing the route to 10.255.255.10

 1   *
    10.9.10.10 0 msec  *
RP/0/0/CPU0:XRv-1
Why is this so? Because someone decided to obfuscate the main thing traceroute relies on, TTL.
RP/0/0/CPU0:XRv-1#show run | i propa
Sun Jul 10 17:01:02.001 UTC
Building configuration...
mpls ip-ttl-propagate disable
RP/0/0/CPU0:XRv-1#
Mike now considers how he will sniff out this latency. He could check the logs of various routers for issues; Yet, how would he know which routers the flow would traverse? He knows that the equal cost paths of the routers provides multiple ways to reach the Z-end, but the ultimate path is determined by the 7-tuple hash calculation. He also knows that traceroute might cause him to miss something – due to the paris traceroute problem – even if he found a way to perform one.
Mike desperately hopes that the issue is perhaps with the CE routers, or the last mile, as that would be a toss-over to field ops.
RP/0/0/CPU0:XRv-1# ping 10.10.10.10  vrf CUST-1
Sun Jul 10 17:07:02.890 UTC
Type escape sequence to abort.
Sending 5, 100-byte ICMP Echos to 10.10.10.10, timeout is 2 seconds:
!!!!!
Success rate is 100 percent (5/5), round-trip min/avg/max = 1/1/1 ms
RP/0/0/CPU0:XRv-1#

RP/0/0/CPU0:XRv-10#ping 10.20.20.20  vrf CUST-1
Sun Jul 10 17:07:37.458 UTC
Type escape sequence to abort.
Sending 5, 100-byte ICMP Echos to 10.20.20.20, timeout is 2 seconds:
!!!!!
Success rate is 100 percent (5/5), round-trip min/avg/max = 1/1/1 ms
RP/0/0/CPU0:XRv-10#
Clean as a whistle; Darn. It's time to put the work in.
Mike has to utilize commands that expose the actual forwarding state – i.e. CEF / FIB – rather than what the RIB advises could take place. He reviews Cisco IOS-XR documentation, the packet captures variables, and produces the following command:
show cef vrf CUST-1 exact-route 10.10.10.10 10.20.20.20 protocol tcp source-port 41890 destination-port 22 ingress-interface gigabitEthernet 0/0/0/1
RP/0/0/CPU0:XRv-1#show cef vrf CUST-1 exact-route 10.10.10.10 10.20.20.20 prot$
Sun Jul 10 17:28:54.670 UTC
10.20.20.0/24, version 5, internal 0x1000001 0x0 (ptr 0xa143c3f4) [1], 0x0 (0x0), 0x208 (0xa15832d0)
 Updated Jul 13 23:29:08.783
 local adjacency 10.1.2.2
 Prefix Len 24, traffic index 0, precedence n/a, priority 3
   via GigabitEthernet0/0/0/0
   via 10.255.255.10/32, 3 dependencies, recursive [flags 0x6000]
    path-idx 0 NHID 0x0 [0xa15ebdf4 0x0]
    recursion-via-/32
    next hop VRF - 'default', table - 0xe0000000
    next hop 10.255.255.10/32 via 16010/0/21
     next hop 10.1.2.2/32 Gi0/0/0/0    labels imposed {16010 81539}
RP/0/0/CPU0:XRv-1#
RP/0/0/CPU0:XRv-1#ping 10.1.2.2 count 100
Sun Jul 10 17:28:55.990 UTC
Type escape sequence to abort.
Sending 100, 100-byte ICMP Echos to 10.1.2.2, timeout is 2 seconds:
!!!!!!!!!!!!!!!!!!!!!!!!!!!!!!!!!!!!!!!!!!!!!!!!!!!!!!!!!!!!!!!!!!!!!!
!!!!!!!!!!!!!!!!!!!!!!!!!!!!!!
Success rate is 100 percent (100/100), round-trip min/avg/max = 1/1/9 ms
RP/0/0/CPU0:XRv-1#
Mike then moves onto XRv-2. He then considers the next command he needs to consider the full packet flow, as XRv-2 is a P router simply forwarding the encapsulated packets; It does not have knowledge of the CUST-1 VRF.
He knows that 16010 is the outer label and 81539 is the service label – or the bottom label. All other parameters have not changed. He considers the following two commands:
show mpls forwarding exact-route label 16010 ipv4 10.10.10.10 10.20.20.20 protocol tcp source-port 41890 destination-port 22 ingress-interface gigabitEthernet 0/0/0/0 detail
show mpls forwarding exact-route label 16010 bottom-label 81539 protocol tcp source-port 41890 destination-port 22 ingress-interface gigabitEthernet 0/0/0/0 detail
They're not quite right.... so he scours his documentation and finds the following:
show mpls forwarding exact-route label-stack {16010 81539} ipv4 10.10.10.10 10.20.20.20 protocol tcp source-port 41890 destination-port 22 ingress-interface gigabitEthernet 0/0/0/0 detail
Perfect. Mike utilizes his IS-IS adjacency, to determine the ingress interface each router will receive the packet on. He then runs the above command and determines the next-hop. He will ping each hop and continue on, until he finds the problematic router or link.
RP/0/0/CPU0:XRv-2#show isis topology | utility egrep -iw XRv-1
Sun Jul 10 17:44:53.815 UTC
XRv-1           10      XRv-1           Gi0/0/0/0       0c97.2455.0001
RP/0/0/CPU0:XRv-2#show mpls forwarding exact-route label-stack {16010 81539} i$
Sun Jul 10 17:45:14.903 UTC
Local  Outgoing    Prefix             Outgoing     Next Hop        Bytes
Label  Label       or ID              Interface                    Switched
------ ----------- ------------------ ------------ --------------- ------------
16010  16010       SR Pfx (idx 10)    Gi0/0/0/2    10.2.7.7        N/A
     Updated: Jul 10 16:23:42.658
     Via: Gi0/0/0/2, Next Hop: 10.2.7.7
     Label Stack (Top -> Bottom): { 16010 }
     NHID: 0x0, Encap-ID: N/A, Path idx: 0, Backup path idx: 0, Weight: 0
     MAC/Encaps: 14/18, MTU: 1500

RP/0/0/CPU0:XRv-2#ping 10.2.7.7 count 100
Sun Jul 10 17:45:25.512 UTC
Type escape sequence to abort.
Sending 100, 100-byte ICMP Echos to 10.2.7.7, timeout is 2 seconds:
!!!!!!!!!!!!!!!!!!!!!!!!!!!!!!!!!!!!!!!!!!!!!!!!!!!!!!!!!!!!!!!!!!!!!!
!!!!!!!!!!!!!!!!!!!!!!!!!!!!!!
Success rate is 100 percent (100/100), round-trip min/avg/max = 1/1/9 ms
RP/0/0/CPU0:XRv-2#

RP/0/0/CPU0:XRv-7# show isis adjacency | i XRv-2
Sun Jul 10 17:45:46.211 UTC
XRv-2          Gi0/0/0/0        0c3a.f889.0003 Up    26   01:22:25 Yes None None
RP/0/0/CPU0:XRv-7#show mpls forwarding exact-route label-stack {16010 81539} i$
Sun Jul 10 17:45:52.241 UTC
Local  Outgoing    Prefix             Outgoing     Next Hop        Bytes
Label  Label       or ID              Interface                    Switched
------ ----------- ------------------ ------------ --------------- ------------
16010  16010       SR Pfx (idx 10)    Gi0/0/0/3    10.6.7.6        N/A
     Updated: Jul 10 16:23:44.659
     Via: Gi0/0/0/3, Next Hop: 10.6.7.6
     Label Stack (Top -> Bottom): { 16010 }
     NHID: 0x0, Encap-ID: N/A, Path idx: 0, Backup path idx: 0, Weight: 0
     MAC/Encaps: 14/18, MTU: 1500

RP/0/0/CPU0:XRv-7#ping 10.6.7.6 count 100
Sun Jul 10 17:46:07.299 UTC
Type escape sequence to abort.
Sending 100, 100-byte ICMP Echos to 10.6.7.6, timeout is 2 seconds:
!!!!!!!!!!!!!!!!!!!!!!!!!!!!!!!!!!!!!!!!!!!!!!!!!!!!!!!!!!!!!!!!!!!!!!
!!!!!!!!!!!!!!!!!!!!!!!!!!!!!!
Success rate is 100 percent (100/100), round-trip min/avg/max = 1/1/9 ms
RP/0/0/CPU0:XRv-7#


RP/0/0/CPU0:XRv-6#show isis adjacency | i XRv-7
Sun Jul 10 17:46:30.248 UTC
XRv-7          Gi0/0/0/5        0cf0.832b.0004 Up    9    01:23:08 Yes None None
RP/0/0/CPU0:XRv-6#show mpls forwarding exact-route label-stack {16010 81539} i$
Sun Jul 10 17:46:34.228 UTC
Local  Outgoing    Prefix             Outgoing     Next Hop        Bytes
Label  Label       or ID              Interface                    Switched
------ ----------- ------------------ ------------ --------------- ------------
16010  16010       SR Pfx (idx 10)    Gi0/0/0/3    10.6.9.9        N/A
     Updated: Jul 10 16:23:44.049
     Via: Gi0/0/0/3, Next Hop: 10.6.9.9
     Label Stack (Top -> Bottom): { 16010 }
     NHID: 0x0, Encap-ID: N/A, Path idx: 0, Backup path idx: 0, Weight: 0
     MAC/Encaps: 14/18, MTU: 1500

RP/0/0/CPU0:XRv-6#ping 10.6.9.9 count 100
Sun Jul 10 17:46:40.547 UTC
Type escape sequence to abort.
Sending 100, 100-byte ICMP Echos to 10.6.9.9, timeout is 2 seconds:
!!!!!!!!!!!!!!!!!!!!!!!!!!!!!!!!!!!!!!!!!!!!!!!!!!!!!!!!!!!!!!!!!!!!!!
!!!!!!!!!!!!!!!!!!!!!!!!!!!!!!
Success rate is 100 percent (100/100), round-trip min/avg/max = 199/204/299 ms
RP/0/0/CPU0:XRv-6#
Wow. There it is. 200ms of latency! He quickly moves to the other router to see if the latency seems to be specific to the link, or the router:
RP/0/0/CPU0:XRv-9#ping 10.9.10.10 count 100
Sun Jul 10 17:48:16.181 UTC
Type escape sequence to abort.
Sending 100, 100-byte ICMP Echos to 10.9.10.10, timeout is 2 seconds:
!!!!!!!!!!!!!!!!!!!!!!!!!!!!!!!!!!!!!!!!!!!!!!!!!!!!!!!!!!!!!!!!!!!!!!
!!!!!!!!!!!!!!!!!!!!!!!!!!!!!!
Success rate is 100 percent (100/100), round-trip min/avg/max = 1/1/9 ms
RP/0/0/CPU0:XRv-9#show isis adjacency | i XRv-6
Sun Jul 10 17:48:46.749 UTC
XRv-6          Gi0/0/0/1        0c83.0a4f.0004 Up    7    01:25:24 Yes None None
RP/0/0/CPU0:XRv-9#

RP/0/0/CPU0:XRv-10#  ping 10.9.10.9 count 100
Sun Jul 10 17:48:22.900 UTC
Type escape sequence to abort.
Sending 100, 100-byte ICMP Echos to 10.9.10.9, timeout is 2 seconds:
!!!!!!!!!!!!!!!!!!!!!!!!!!!!!!!!!!!!!!!!!!!!!!!!!!!!!!!!!!!!!!!!!!!!!!
!!!!!!!!!!!!!!!!!!!!!!!!!!!!!!
Success rate is 100 percent (100/100), round-trip min/avg/max = 1/1/9 ms
RP/0/0/CPU0:XRv-10#
Both tests are clean. The issue does not appear to be XRv-9 itself. The issue seems to be when packets flow on the link between XRv-6 & XRv-9. Mike passes the ticket over to the TNOC. The TNOC finds an issue with one of the DWDM shelves and takes action.
After this is completed, Susan is happy to find that SSH is now responsive and her packets are flowing without issue:
susan@Host-1:~$ ping 10.20.20.1 -c 3
PING 10.20.20.1 (10.20.20.1) 56(84) bytes of data.
64 bytes from 10.20.20.1: icmp_seq=1 ttl=61 time=7.94 ms
64 bytes from 10.20.20.1: icmp_seq=2 ttl=61 time=8.39 ms
64 bytes from 10.20.20.1: icmp_seq=3 ttl=61 time=8.30 ms

--- 10.20.20.1 ping statistics ---
3 packets transmitted, 3 received, 0% packet loss, time 2002ms
rtt min/avg/max/mdev = 7.948/8.215/8.399/0.220 ms
susan@Host-1:~$
Ask yourself how you would trace a flow in your network